
Test Systems / RBTS
Roy Billinton Test System (RBTS)
Original 1989 six-bus reliability test system, published distribution and overall-system extensions, source-attributed numerical tables, original-form configuration diagrams and contributed engineering cases.
Original reference and evolution
The 1989 RBTS comprises 6 buses, 11 generating units and 9 transmission lines. Its geographically suggestive diagram depicts lines in proportion to their lengths. The 1991 publication introduces Bus 2 and Bus 4 distribution systems; later work extends it toward overall-system assessment.
1989 Basic Data · 1990 Basic Results · 1991 Basic Distribution Data and Results
Numerical datasets
Selected available research tables. Numerical transcription remains under review. Original data and later published extensions are not merged silently.
| Year | Dataset | Formats |
|---|---|---|
| 1989 | Generation units | CSV · JSON · TXT |
| 1989 | Generator reliability | CSV · JSON · TXT |
| 1989 | Generator costs | CSV · JSON · TXT |
| 1989 | Bus peak loads | CSV · JSON · TXT |
| 1989 | Power-flow data | CSV · JSON · TXT |
| 1989 | Transmission electrical | CSV · JSON · TXT |
| 1989 | Transmission outage rates | CSV · JSON · TXT |
| 1989 | Station components | CSV · JSON · TXT |
| 1989 | Load-duration data (review only) | CSV · JSON · TXT |
| 1989 | Customer interruption damage | CSV · JSON · TXT |
| 1991 | Customer load points | CSV · JSON · TXT |
| 1991 | Feeder loading | CSV · JSON · TXT |
| 1991 | Feeder section lengths | CSV · JSON · TXT |
| 1991 | Distribution assumptions | CSV · JSON · TXT |
| 1991 | Published system indices | CSV · JSON · TXT |
Original RBTS network and station-configuration diagrams
These five drawings were supplied by the model developer. They distinguish the basic network model from four alternative station arrangements. No abstract or conceptual distribution overview is presented as a source-equivalent SLD.
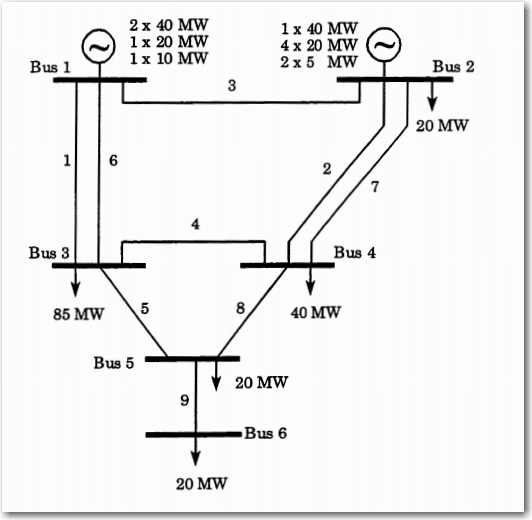
RBTS No Stations.jpg
Open / download original JPEG
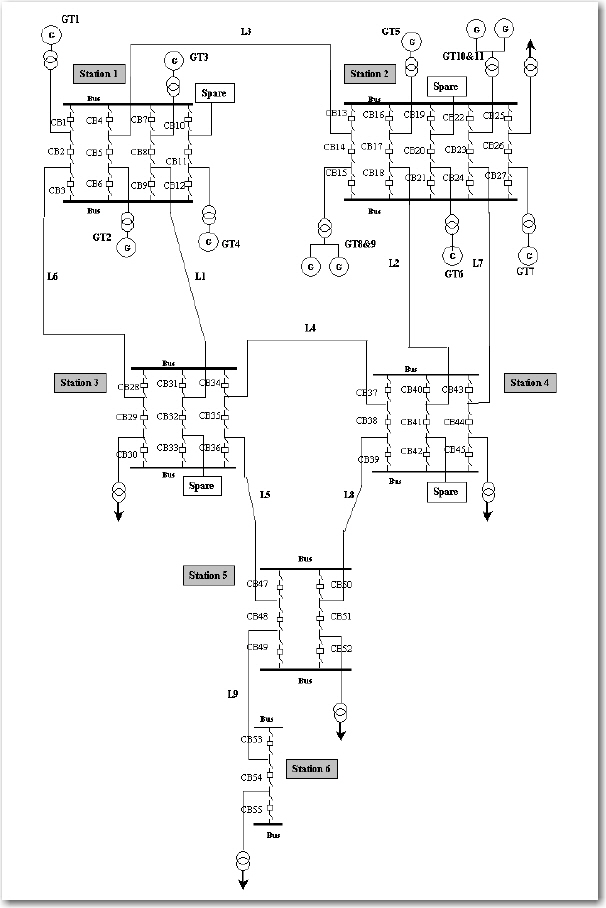
RBTS Breaker One & One Half.jpg
Open / download original JPEG
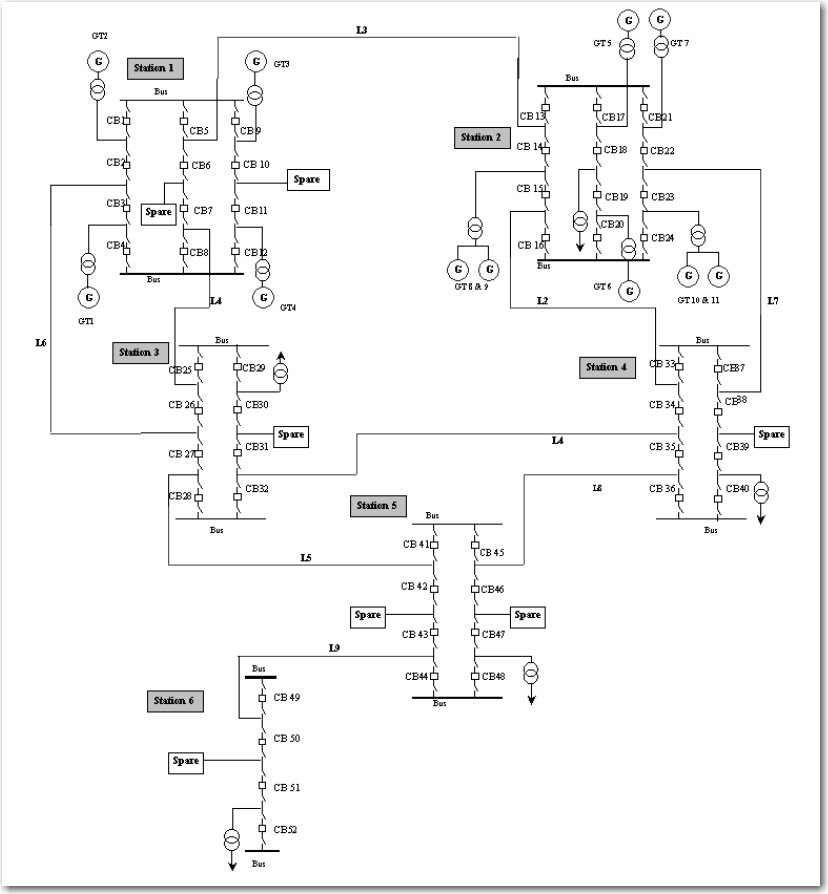
RBTS Breaker One & One Third.jpg
Open / download original JPEG
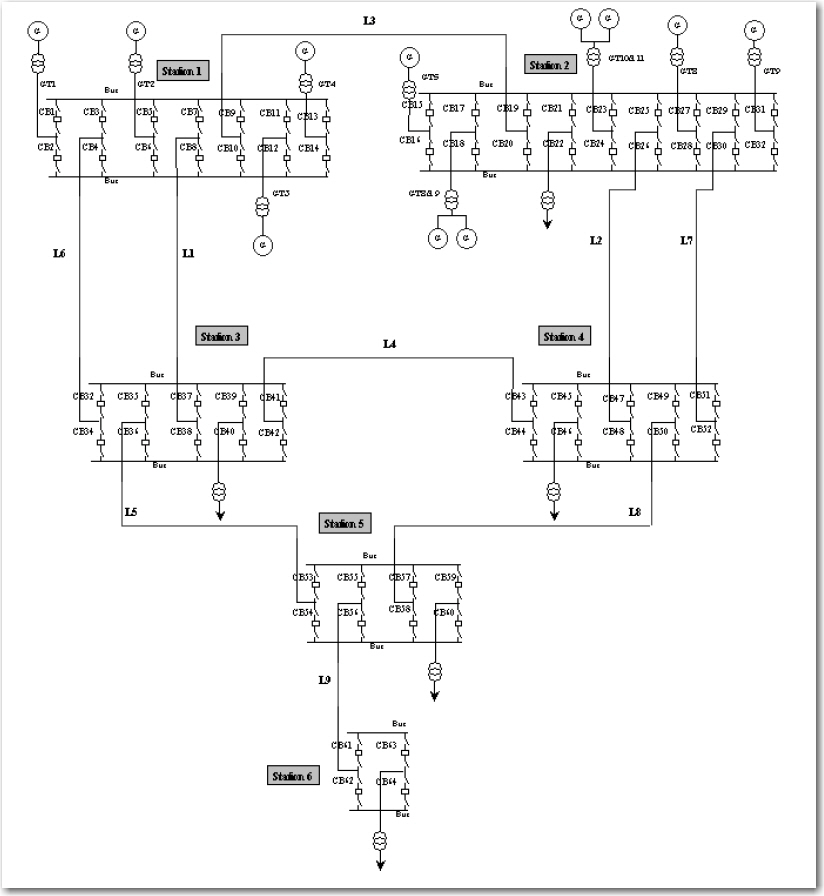
RBTS DBDB.jpg
Open / download original JPEG
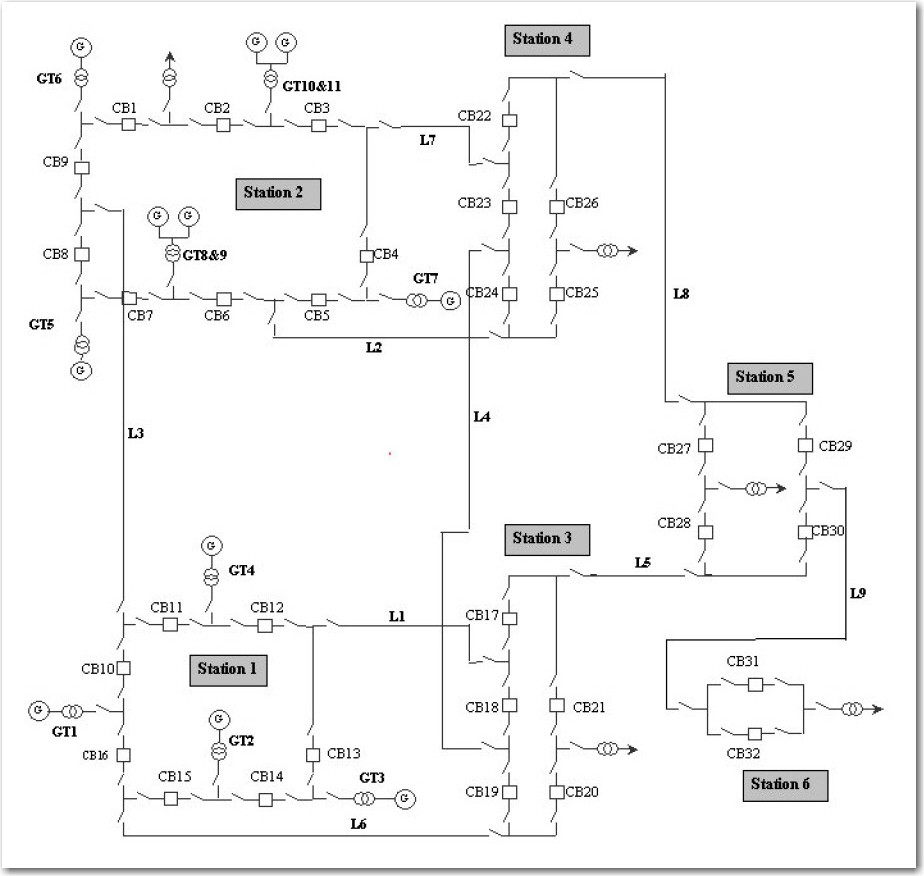
RBTS Ring.jpg
Open / download original JPEG
gri-us.com paths, but binary image upload is pending. The original JPEGs are preserved unchanged. The detailed Bus 2 and Bus 4 distribution single-line diagrams from the 1991 paper will be added only when accurate versions are available.Engineering models and SUBREL study files
Original native files are organized by RBTS configuration and study purpose. Each listed file is a separately supplied engineering artifact; no unsupported conversion formats have been added. File publication status: all fifteen contributed engineering files are now hosted on the GR main website and individually downloadable. The original five station JPEG diagrams above are also available.
Basic RBTS — no detailed substations
Configuration figure: RBTS No Stations.jpg
| Supplied file | Purpose | Publication |
|---|---|---|
RBTS.RAW | PSS/E six-bus bus-branch case | Download available |
RBTS.sav | PSS/E saved binary case | Download available |
rbts.pwb | PowerWorld case | Download available |
RBTS.pwd | PowerWorld one-line drawing | Download available |
rbts.AUX | PowerWorld auxiliary case data | Download available |
The original six-bus representation is distinct from the detailed station models.
Breaker-and-a-half substations
Configuration figure: RBTS Breaker One & One Half.jpg
| Supplied file | Purpose | Publication |
|---|---|---|
RBTSBreakerandHalf.pwb | PowerWorld case | Download available |
RBTSBreakerandHalf.pwd | PowerWorld one-line drawing | Download available |
The original contributor-supplied PWB and PWD are a matching model/display pair by filename.
Ring substations
Configuration figure: RBTS Ring.jpg
| Supplied file | Purpose | Publication |
|---|---|---|
RBTSRingSubstations.raw | PSS/E RAW network | Download available |
RBTSRingSubstations.pwb | PowerWorld case | Download available |
RBTSRingSubstations.pwd | PowerWorld one-line drawing | Download available |
The RAW file includes explicit additional switching nodes compared with the six-bus base case.
Ring-substation SUBREL study
| Supplied file | Purpose | Publication |
|---|---|---|
RBTS Ring N-1F N-1S SUBREL.subrel | SUBREL project | Download available |
RBTS Ring N-1F N-1S SUBREL.mdb | Microsoft Access database | Download available |
RBTS Ring N-1F N-1S SUBRELPSSE.con | PSS/E contingency export | Download available |
RBTS Ring N-1F N-1S SUBRELPWCon.aux | PowerWorld contingency export | Download available |
These are related SUBREL project/database/export files; the 484-case contingency export scope must not be confused with the broader historical workbook.
Three-configuration historical reliability results
| Supplied file | Purpose | Publication |
|---|---|---|
RBTS N-2F N-1S SUBREL Results.xlsx | Original workbook: no detailed stations, breaker-and-a-half, ring | Download available |
Historical SUBREL results pending independent InfraRel reproduction. Summary values are already available below.
Other station figures without matching model files in this collection
Breaker one-and-one-third and double-bus double-breaker (DBDB) are available as original JPEG diagrams. Corresponding PWB/PWD pairs have not been supplied and are not implied.
Historical SUBREL comparison: three RBTS substation arrangements
Historical study · Supplied workbook · Not independently reproduced
This worked example compares the original RBTS without detailed substations, a breaker-and-a-half arrangement, and a ring-substation arrangement. Results below are transcribed from the author's RBTS N-2F N-1S SUBREL Results.xlsx workbook. They are not results from InfraRel. The study scope includes up to N-2 forced faults and N-1 stuck-breaker conditions as described in the workbook, subject to configuration-specific enumeration.
Reported system reliability indices
| Indicator | No detailed substations | Breaker-and-a-half | Ring |
|---|---|---|---|
| SAIFI (interruptions/customer-year) | 1.99691 | 2.71903 | 3.20337 |
| SAIDI (minutes/customer-year) | 618.83838 | 823.16687 | 1,051.01868 |
| CAIDI (minutes/interruption) | 309.89731 | 302.74243 | 328.09814 |
| ASAI | 0.9988226295 | 0.9984338284 | 0.9980003238 |
| Energy unserved (kWh/year) | 259,547 | 729,138 | 826,127 |
| Reported outage costs ($/year) | 1,213,545 | 26,140,644 | 27,725,088 |
Contingency enumeration
| Category | No detailed stations | Breaker-and-a-half | Ring |
|---|---|---|---|
| N-1 forced outage | 31 | 121 | 92 |
| N-1 isolation | 29 | 121 | 92 |
| N-2 forced outage | 406 | 5,882 | 3,721 |
| N-1 isolation + N-1 forced outage | 830 | 14,520 | 8,372 |
| N-1 forced outage + N-1 stuck | 0 | 426 | 300 |
| Credible contingencies | 1,296 | 21,070 | 12,577 |
| Contingencies causing partial load loss | 226 | 5,522 | 4,952 |
Supporting SUBREL files and planned reproducibility
A separate ring-substation SUBREL project and Microsoft Access database, with PSS/E and PowerWorld contingency exports, have been supplied and preserved. A 484-case ring N-1 fault / stuck-breaker export set is not equivalent to the complete 12,577-credible-contingency enumeration shown above; the study scopes must be reconciled before comparison. Original project/database and model binaries are being prepared for GR-domain distribution.
Reference results and other studies
Published 1991 distribution-system indices are included in the review datasets. Historical SUBREL three-configuration summary results are now shown above; original 1990 results and new InfraRel comparison outputs remain to be reproduced and source-checked. Renewal, storage, microgrid and AI variations will be published with separate provenance and assumptions.
Research history
The original system was developed by the University of Saskatchewan Power Systems Research Group under Professor Roy Billinton. Dr. Sudhir Kumar Agarwal, who published as S. Kumar, coordinated the 1988–1989 research and was the principal writer of the foundational papers. The repository is maintained as an open educational and technical resource.